ARTeMIS Modal Case Studies
If you are interested in viewing some real-life case-studies where ARTeMIS Modal has been used, then please have a look at the links below showing several examples of Operational Modal Analysis.
The measurements and analysis presented here are performed by Professor Carlos Ventura, University of British Columbia, Vancouver, Canada. The building considered is the so-called Heritage Court Tower, which is located in downtown Vancouver, British Columbia, Canada. It is a relatively regular 15-storey reinforced concrete shear core building. The building is located on top of an underground parking structure. The measurements were conducted using an 8-channel measurement system. The sensors were Kinemetrics Episensor, forced balanced accelerometers. Modal analysis was conducted with ARTeMIS Modal Pro.
The analysis is divided into four Test Setups, where the sensors are moved to new locations leaving only two in fixed reference positions. ARTeMIS Modal supports single as well as multiple Test Setups analysis. The configuration file as well as the measurement files for project is installed along with ARTeMIS Modal.
Pictures from the Test
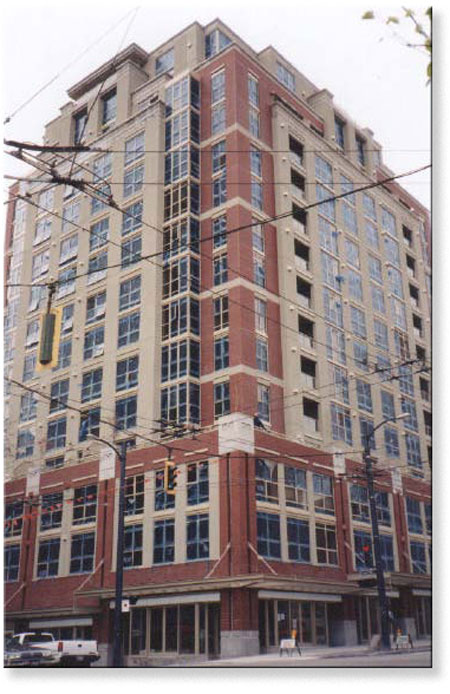 The Heritage Court Tower building in Vancouver, British Columbia, Canada
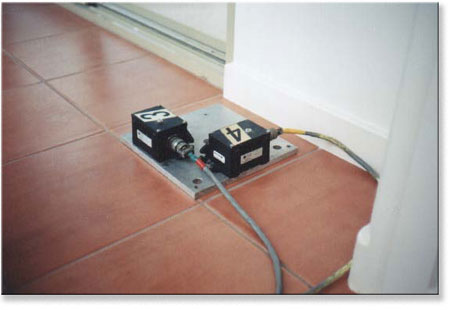 A 2-directional measurement position using Kinemetrics Episensors
This case study presents a novel application of the Damage Detection plugin available in ARTeMIS Modal Pro. It shows how the plugin is used with measurements obtained from the Dogna bridge in Italy in the spring of 2008 by Professor Morassi of the Dipartimento di Ingegneria Civile e Architettura at the Università degli Studi di Udine, Italy, and Professor Benedettini of the Dipartimento di Ingegneria Civile, Edile-Architettura e Ambientale at the Università degli studi dell'Aquila, Italy. Structural Vibration Solutions A/S gratefully acknowledges both professors for their help with this case study and for sharing the measurements, photos and relevant information about this bridge.
Dogna Bridge and the Exceptional Flooding of 2003
The Dogna bridge crosses the River Fella and connects the villages of Crivera and Valdogna (Dogna) in Friuli Venezia Giulia, a region located in the North East of Italy.
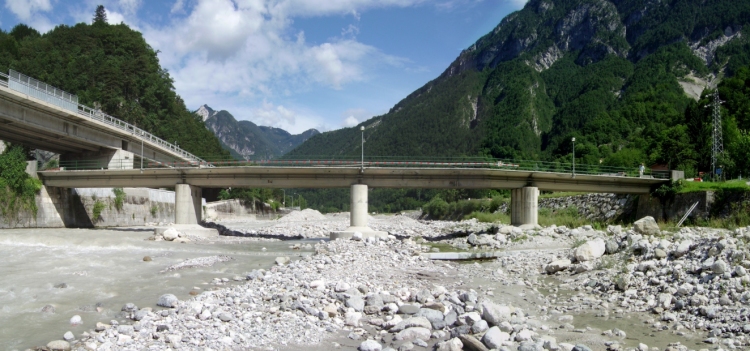 Figure 1: The Dogna bridge crossing the River Fella.
As shown in Figure 1, the bridge is a four-span, single-lane concrete bridge. The length of each span is 16 m, and the lane is about 4 m width. The bridge deck is made of a reinforced concrete (RC) slab 0.18 m thick, supported by three longitudinal RC beams with a rectangular cross-section 0.35 x 1.20 m. The beams are simply supported and rest at the ends on thin metallic sheets.They are connected at the supports, at midspan and at span quarters with rectangular cross-section RC diaphragms (0.3 x 0.7 m). Each pier is a RC wall about 1.5 m thick, 4.5 m deep, and around 3.6 m high. The abutments consist of RC walls, 1 m thick. Piers and abutments were built on cast-in-place concrete piles of 1 m in diameter and 18 m in length.
On August 31, 2003 the bridge suffered severely due to an exceptional flood of the Fella River. At that time, due to the material deposited upstream, the deck structures of the bridge were overtop by the flow of the water as seen in the pictures below.
Figure 2: Pictures of the actual flooding on August 31, 2003.
A visual inspection conducted on the bridge revealed no apparent deterioration of the slab and beams, whereas a state of degradation was noticed on support bearing side pier. For traffic safety reasons, the Dogna bridge was demolished on May 2008 and has been replaced by a new bridge built about 200 m downstream.
The Experimental Campaign
A testing campaign was carried out from April 2 to April 11, 2008 and consisted of a series of tests of progressive damage of one of the bridge spans. The tested span was made independent of the adjacent span by removing the deck-joint of the pier. Moreover, the asphalt overlay of about 0.1 m thickness was also removed before testing. All the tests were carried out under similar environmental and weather conditions so that the influence of temperature and humidity on the dynamic modal parameters would not be a factor of significant importance. Figure 3 shows the bridge span during the tests and how the progressive damage was introduced artificially.
Figure 3: Asphalt overlay was removed, and bridge span was made independent of the adjacent span. Damage was artificially introduced. Up to three cuts of one of the supporting beams as well as the introduction of a damage in the centerline of the side beam.
| Test Case |
Measurement Date |
Description |
| Reference |
April 3, 2008 |
Measurements made before any artificial damage was introduced. |
| D1 |
April 3, 2008 |
Measurements made after the first half cut of one of the beams, see Figure 3. |
| D2 |
April 4, 2008 |
Measurements made after the first cut of the beam was completed. |
| D3 |
April 24, 2008 |
Measurements made after three cuts of a beam and the introduction of damage in the centerline of the side beam. |
Table 1: List of the measurement campaign. One reference case and three damaged are used in this case study.
Undamaged Measurements
Before the progressive damage was introduced artificially, a reference Ambient Vibration Test was conducted for 20 minutes in 10 locations on the bridge span. The total number of samples acquired was 475341. The figure 4 below shows the first four modes of the structure.
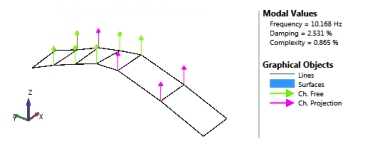 Figure 4: First 4 fundamental modes of the bridge span.
In order to establish the thresholds for being inside the safe zone, the damage detection plugin needs multiple files that ultimately result in multiple indicator values. In order to accomplish this, the undamaged measurement record was divided into eight separate measurement files. The six first were then used to create the reference state model, and the remaining two were used to validate the performance of the reference state model.
Procedure for Establishing the Reference State Model
The following describes the steps required to establish the reference state (baseline) model.
- Define a new External Storage ARTeMIS Modal project using e.g. the interactive setup tools or from a SVS Configuration File. Here the configuration file used previously for the above Operational Modal Analysis was re-used by replacing the original undamaged measurement file with the first of the eight subdivided measurement files.
- In ARTeMIS Modal Pro, measurements and associated results are stored as Analysis Sessions. This allows the storage and presentation of historical development of the results obtained from different measurements. Each time a measurement is uploaded, ARTeMIS Modal Pro will create a new Analysis Session and associate it to the uploaded measurement. The Signal Processing dialog in the Prepare Data task is used to configure how the uploaded measurements for this first Analysis Session should be processed. Here we chose to decimate the measurements and end up selecting this initial Analysis Session as the Master Session. The parameters in the Master Session are used for all other Analysis Sessions that will be created in the project.
- The remaining seven reference measurement files are then uploaded. By switching to the Analysis History task, the uploading of the files can be done simply by dragging them from the Windows Explorer to the Analysis History window. The files are then automatically uploaded and processed. In Figure 5 below, the top left picture shows the list of reference Analysis Sessions. The green check mark indicates that the signal processing is complete for each session.
- When all the reference measurements are uploaded and processed, it is possible to configure how the damage detection algorithms should estimate the reference state model. In Figure 5, the Damage Detection configuration dialog is shown. In this dialog, the Start and End Reference Analysis Sessions are selected as the first six out of the eight, and the Start button is pressed. This will create the reference state model, the statistical thresholds and damage indicators of the eight reference measurements, see Figure 6.
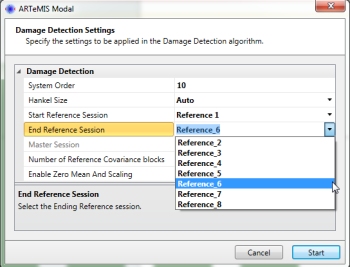 Figure 5: Establishing the reference state model. It consists of the six measurements uploaded and stored in their own Analysis Sessions. In the Analysis History task window, the Damage Detection configuration dialog is used to select the range of Analysis Sessions to use measurements from in the reference state model. Once established, the Chi Square damage indicators of each of the six reference measurements are calculated and used to estimate the Safe-Zone and Critical-Zone thresholds.
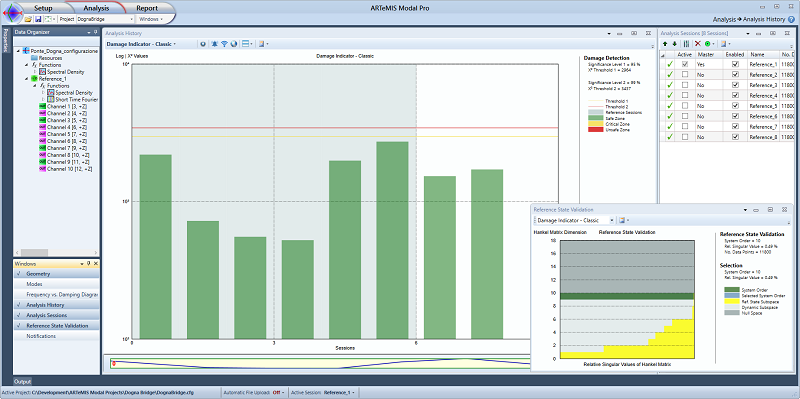 Figure 6: Once the reference state model and thresholds are estimated, all uploaded measurements are presented by the damage indicators. Here the six first inside the gray zone are the ones used to establish the reference state model, and the remaining two are used to validate that new data from the same reference state is actually within the safe zone as well. In addition, it is possible to investigate the null space estimation of the reference state model. In the diagram called Reference State Validation, singular values of the null space are presented as the upper dark-gray zone. The singular values should preferably be zero in this region, which is the case here, where no yellow singular values can be seen above the indicator of the selected system order.
Damage Detection
Once the Reference State Model has been estimated along with the thresholds, it is a simple matter to test the three damage cases presented in Table 1. The measurement files for each of the damage cases are simply dragged from the Windows Explorer to the Analysis History window that will process them automatically and present the associated damage indicators. If there is a significant change of the dynamics, the indicators will pass the thresholds. Changes in the dynamics of the structure beyond the threshold levels will be shown as red colored bars on the chart. Larger bars indicate very significant changes on the structural system which can be related to damage of the structure. In Figure 7 below, the indicators are shown for the three damage cases, and they all indicate a significant change of the dynamic behavior of the structure. Also, it is clear that the damage is increasing from the first to the last damage case, as expected.
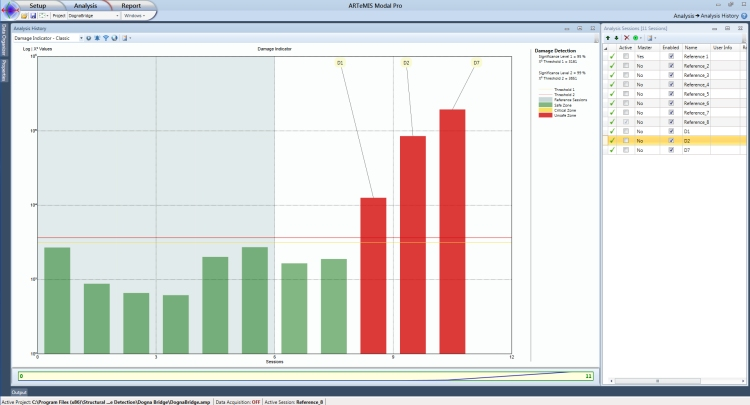 Figure 7: All damage indicators presented. The first 8 green ones are from the reference (undamaged) measurements and the last three red ones are from the three cases of progressive damage, D1, D2 and D7.
Conclusion
This case study demonstrates the use of the Damage Detection plugin in ARTeMIS Modal Pro. A reference state model is constructed from uploading a series of measurement files all describing the reference state of the structure. Once the reference state model is constructed, damage detection is performed simply by dragging measurement files, acquired from the potentially damaged structure, into the Analysis History window. The damage indicators are then automatically calculated and presented either in green (safe state), yellow (critical state) or red (unsafe state).
The results presented here were obtained by performing a re-analysis with ARTeMIS Modal Pro of the database created by Professors Alvaro Cunha and Elsa Caetano (Laboratory of Vibrations and Structural Monitoring of the Faculty of Engineering of the University of Porto, Portugal) during the dynamic tests performed on the Vasco da Gama Bridge at the commissioning stage, under contract with Novaponte ACE
The Vasco da Gama bridge is located near Lisbon and is the second crossing of the Tejo river. Three types of test were done: Ambient vibration test, free vibration test and measurements in the stay cables. The results shown below are based on the ambient vibration test. The equipment used were 6 triaxial GeoSIG seismographs synchronized by a portable PC.
Below a series of pictures of the bridge are shown. They show it during and after construction:
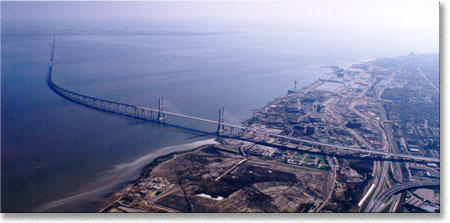 The Vasco da Gama bridge in its full length, seen from northern edge of the Tejo (Tagus) river.
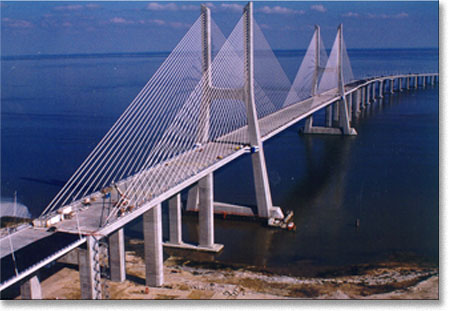
 The main span consist of a cable stayed bridge.
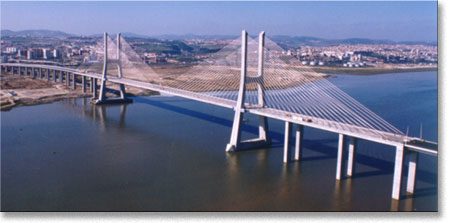
 The main span seen from the northern edge of the Tejo river.
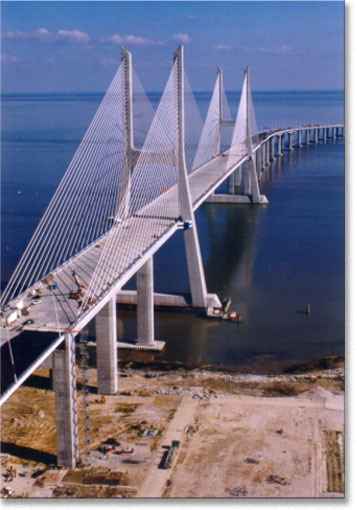
 The main span seen from the southern edge of the Tejo river.
 The bridge during construction.
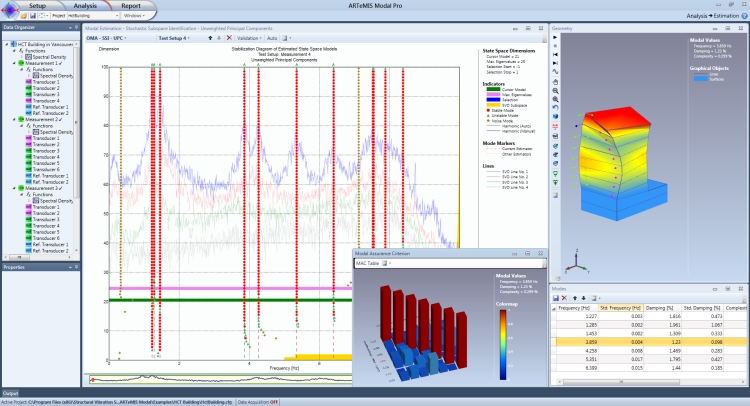
The modal analysis has been performed using the Crystal Clear Stochastic Subspace Identification estimator available in the ARTeMIS Modal Pro version. Below a screen dump show the stabilization diagram obtained from one of the Test Setups. In addition, the Modal Assurance Criterion (MAC) between all the modes is shown, and reveal that the mode shapes a orthogonal.
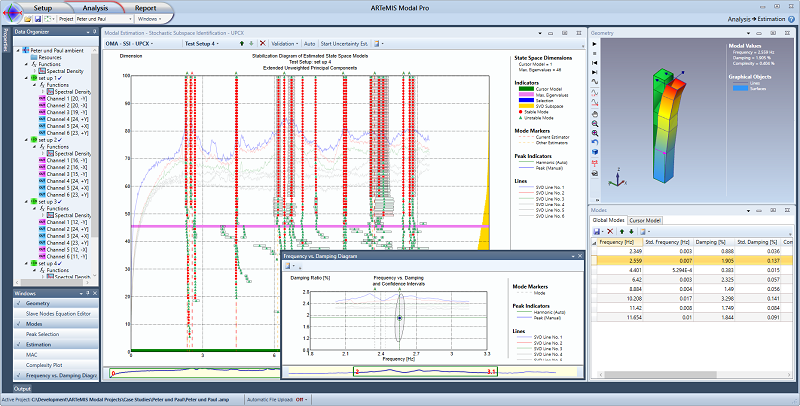
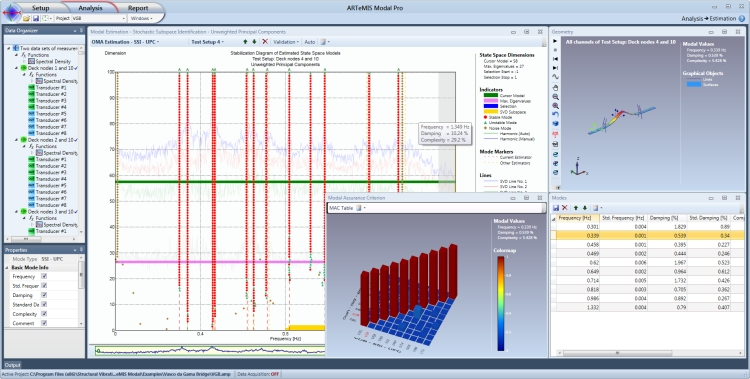 Crystal Clear Stochastic Subspace Identification of the modes of the bridge.
Below the modes are presented. The modes has been estimated with default settings of the Crystal Clear Stochastic Subspace Identification estimator available in the ARTeMIS Modal Pro version.
The measurements and analysis presented here are performed by Dr. Reto Cantieni, RCI Dynamics, Switzerland.
This case consider measurements conducted on the bell tower of the St. Peter & Paul church in Zürich, Switzerland. The measurements were conducted using a LMS Pimento data acquisition system. The sensors were PCB 93B31 accelerometers. The measurement campaign was divided into four Test Setups of six channels each. Three reference sensors were placed in to top of the tower in two perpendicular directions, and the rest of the sensors were roving from one Test Setup to another.
Below some pictures from the test is shown:
 The St. Peter & Paul church in downtown Zürich, Switzerland.
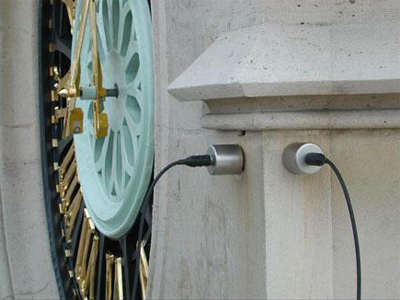 Mounting of two PCB accelerometers next to the church clock.
 Mounting reference accelerometers on the top corner of the bell tower.
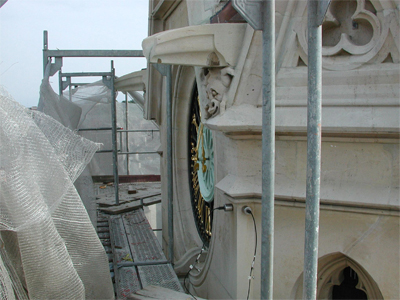
 Mounting of accelerometers for 2D measurement inside the tower.
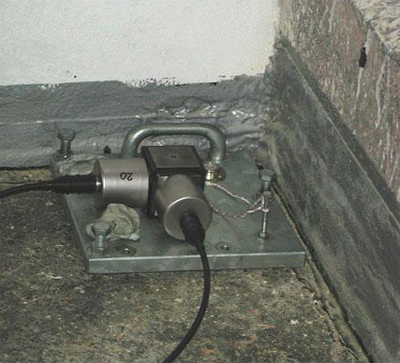
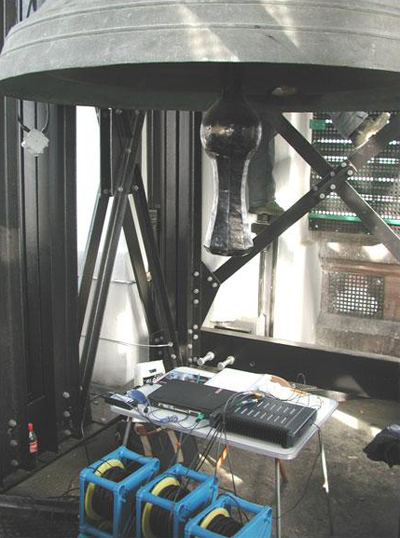 The measurement control station located just beneath the church bell.
The modal analysis was made ARTeMIS Modal Pro using Extended Unweighted Principal Components Stochastic Subspace Identification (SSI-UPCX).
Modal Analysis using SSI-UPC Merged Test Setups
This case study presents an Operational Modal Analysis made using the SSI-UPC Merged Test Setups algorithm available in ARTeMIS Modal Pro.
The results of an Ambient Vibration Test and Analysis of the Infante D. Henrique Bridge are presented below. The measurements have been made by Professors Alvaro Cunha and Filipe Magalhães, Faculdade de Engenharia da Universidade do Porto, Laboratory of Vibrations and Monitoring (http://paginas.fe.up.pt/vibest/), Porto, Portugal.
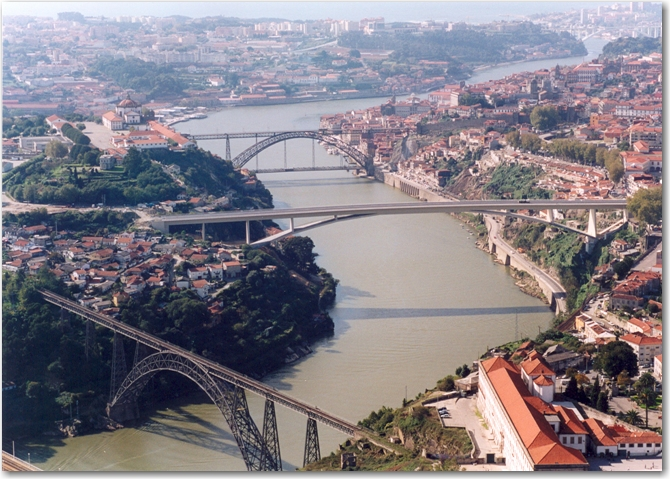
The Infante D. Henrique Bridge in Porto, Portugal
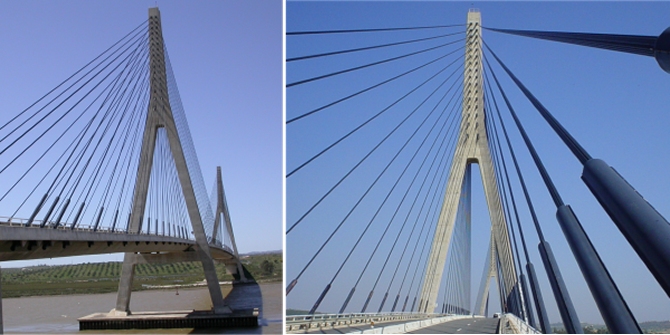
The Infante D. Henrique Bridge, over the Douro River, was open to traffic in 2004 to link the cities of Porto and Gaia, located at the north of Portugal. The bridge is composed of a rigid prestressed concrete box girder, 4.50m deep, supported by a shallow and thin reinforced concrete arch, 1.50 m thick. The arch spans 280 m between abutments and rises 25 m until the crown. In the 70 m central segment, arch and deck join to define a box girder 6m deep. The arch has constant thickness and its width increases linearly from 10m in the central span up to 20 m at the springs. Below some pictures of the bridge are shown.
 The bridge seen upstream.
 Downstream arial view of the bridge.
The Ambient Vibration Test
The ambient vibration test was made without disturbing the normal use of the bridge, with accelerations induced by traffic and wind. To measure the very low amplitude accelerations, 4 tri-axial 18-bit strong motion recorders were used. During the ambient vibration test, two recorders served as references located permanently at the reference cross-section (see the blue arrows in the figure below) of the deck, in both sides of the deck (upstream and downstream), while the other two recorders scanned the bridge deck measuring the acceleration along the 3 orthogonal directions in both sides of the 15 cross-sections. All sensor positions in all 15 test setups can be seen in the figure below.
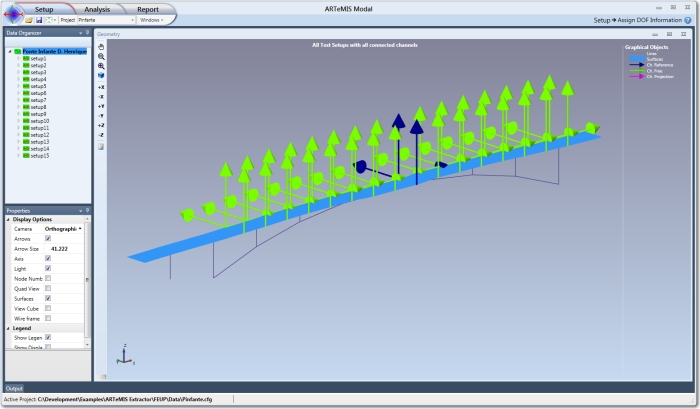 The Assign DOF Information Task displaying all sensors of the 15 Test Setups. The blue arrows are the reference sensors.
For each test setup, time series of 16 minutes were collected. The sampling frequency was 100 Hz, a value that is imposed by the filters of the acquisition equipment and that is much higher than the required for this bridge. Most of the relevant natural frequencies of the bridge are below 10 Hz. Therefore, a decimation of order 5 was applied before the operational modal analysis, reducing the sampling frequency from 100 Hz to 20 Hz.
The SSI-UPC Merged Test Setups Algorithm
The algorithm is developed in cooperation with our strategic partner - the French Institute National de Recherche en Informatique et en Automatique (Inria). This algorithm can be applied in the vast number of cases where several test setups have been measured using a set of fixed positioned reference sensors and a set of rowing sensors being moved across a structure from measurement to measurement. The algorithm can be described by the following steps:
- The input to the algorithm is multiple time series measurements (Test Setups) that typically are uploaded through e.g. the SVS Configuration File.
- Using the Prepare Data Task in ARTeMIS Modal Pro these measurements are then compressed into a set of so-called Common SSI matrices. These matrices are then merged together using a sophisticated scaling technique that utilizes the information of the references sensors of the Test Setups. This scaling technique is introduced to account for a potential change of vibration level from measurement to measurement.
- The estimation of modes are then performed using a single Stabilization Diagram that displays the modal parameters of the range of state space models being estimated. The estimation of the state space models are made using the fast implementation of the Crystal Clear SSI estimator. The global modes are automatically estimated based on the stable modes of the diagram by a single click on the Auto button.
After uploading the 15 Test Setups the Common SSI matrices were estimated using a Max. Dimension of 300. This high dimension has been chosen because of the very low frequency modes of the data and the large number of modes in the data - The larger number and lower the modes are in frequency the higher dimension should be used.
Below the one and only Stabilization Diagram is shown. It displays the Singular Values Decomposition (SVD) of the Spectral Densities of all the Test Setups with an indication of all the global modes based on all Test Setups. The Crystal Clear SSI estimator was applied using a Max. No. of Eigenvalues setting of 66 that was automatically chosen by the algorithms.
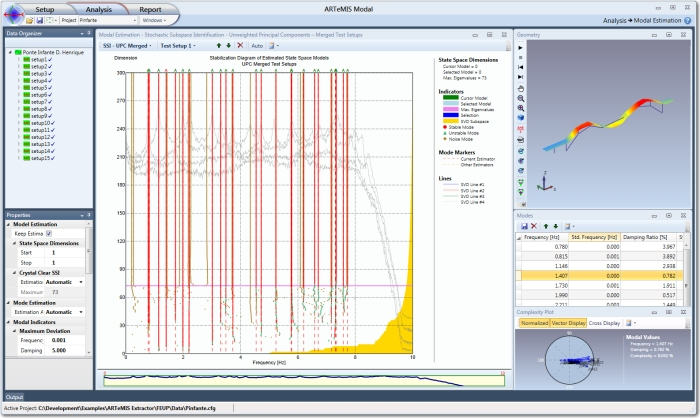 15 Test Setups of data from the Infante D. Henrique Bridge analyzed with SSI-UPC Merged Test Setups estimator in ARTeMIS Modal Pro.
The result is 25 global modes shown in the table below to the left and the Modal Assurance Criterion (MAC) between the modes are shown to the right.
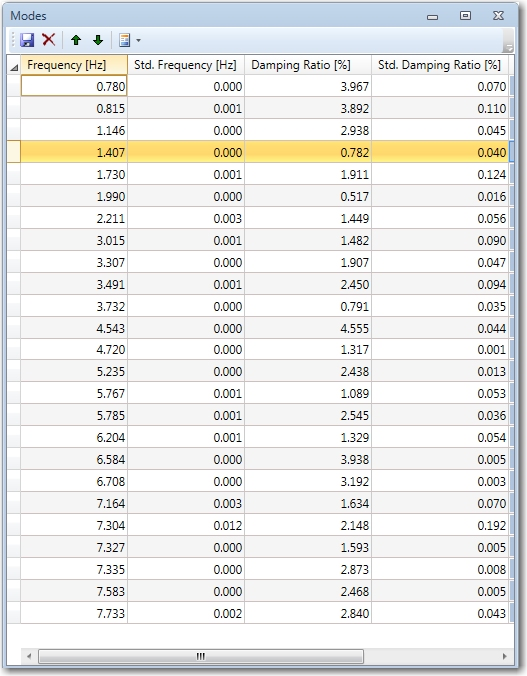 Estimated natural frequencies and damping ratios, and corresponding estimated standard deviations.
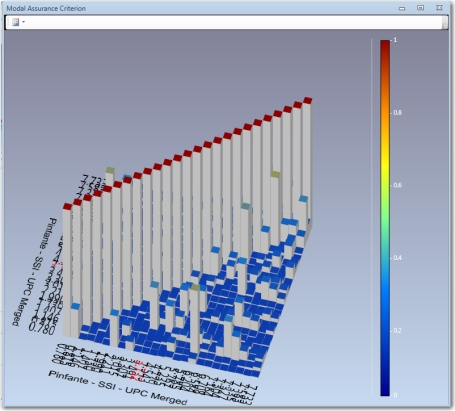 Modal Assusrance Criterion of all estimated modes.
Below mode shapes of six of the estimated modes are shown.
The information described in this case study is by courtesy of the European research projects “Integrated European Industrial Risk Reduction System (IRIS)” and “Internet based Structural Monitoring System (ISMS)”. Special thanks to H. Wenzel (VCE), M. Döhler (Inria), L. Mevel (Inria) and C.E. Ventura (UBC).
Objective 1
This case study demonstrates the use of the powerful Crystal Clear SSI of the ARTeMIS Modal Pro version. The measurements used are from the S101 highway overpass bridge located in Reibersdorf, Austria. The bridge crossed the national highway A1 Westautobahn Austria. It is a post-tensioned concrete bridge with a main span of 32 m, side spans of 12 m, and a width of 6.6 m. The deck is continuous over the piers and is built into the abutments. The bridge, built in 1960, had to be demolished due to some structural problems and to allow some space for additional lanes of the highway underneath.
Within the IRIS project, the bridge was artificially damaged in various ways. The damaging processes were accompanied by a permanent measurement of the static and dynamic behavior of the structure. Within the IRIS and the ISMS project, the acquired dynamic measurements have been used to validate the developed damage detection and damage localization techniques.
The first objective of this first chapter is to describe the Operational Modal Analysis made in the reference state measurement performed before any damages were introduced. In the next objective we will look at the results of the damage detection.
Measurement Campaign
The measurements were carried out by VCE and the University of Tokyo on December 10-13, 2008. The data acquisition system had 45 channels. The record length used in the present analysis was 1,815,009 samples acquired at 500 Hz. Total measurement time used in the analysis is as such just above one hour. All accelerometers were placed on the girder. Below the measurement setup can be viewed. The input configuration file was prepared by Prof. C.E. Ventura, UBC.
Signal Processing
The measurements were decimated from the original Nyquist frequency of 250 Hz to 25 Hz. The Automatic Projection Channel option was used, and it found 4 projection channels that in the following diagrams are highlighted in a magenta color. The Singular Values of the spectral densities reveal several distinct modes as seen below.
Modal Analysis
A quick analysis using the Enhanced Frequency Domain Decomposition method was used to get a "feeling" of what the measurements contained. It showed at least 5 distinct modes. After this the wokhorse of ARTeMIS Modal Pro - Crystal Clear SSI - was used with automatic settings. The Crystal Clear SSI was developed in 2010 in cooperation with the I4S Team at Inria. The stabilization diagram as well as the 6 modes the method found can be seen below.
Additional modes were identified, but were discarted due to too high Modal Complexity and unrealistic high damping.
The six modes of Crystal Clear SSI were validated against each other, and as seen below the Modal Assurance Criterion as well as the Modal Complexity show low correlation and low complexity.
The results were also validated by looking at the Cross Modal Assurance Criterion between Enhanced Frequency Domain Decomposition (EFDD) and Crystal Clear SSI (SSI-UPC). Here the superiority of SSI-UPC is revealed as EFDD is unable to find the first transverse mode and, in general, has a higher complexity for the high order modes. The cross validation is seen below.
The complete analysis, from data upload started to results were ready, took approx. 1 hour. The six modes are shown below and can be downloaded here in Universal File Format.
Objective 2
The objective of this part of the case study is to demonstrates the use of the Damage Detection plug-in developed for the ARTeMIS Modal Pro Software.
Within the IRIS project, the bridge was artificially damaged in various ways. The damaging processes - listed above to the right - were accompanied by a permanent measurement of the static and dynamic behavior of the structure. The measurements were carried out by VCE and the University of Tokyo on December 10-13, 2008. The data acquisition system had 45 channels. Measurement records were dumped continuously, and each file contained 165,000 samples. In total, this case study consists of 689 of these records. Within the IRIS and the ISMS project, the acquired dynamic measurements have been used to validate the developed damage detection and damage localization techniques.
ARTeMIS Modal Pro plugin - Statistical Subspace-based Damage Detection
For a long time, the trend has been to check the health of a structure by comparing modal parameters obtained in a reference state with the modal parameters of a potentially damaged state. This works when a potential damage is causing changes in the normally few modes extracted. However, there might be modes that are affected by a damage, but not easy to extract. The Statistical Subspace-based Damage Detection feature tries to overcome this potential shortcoming of the explicit modal analysis. The major benefits of the new feature are:
- No modal parameter estimation necessary.
- The full dynamic system is compared implicitly instead of comparing a few modes.
- Robust estimation in case of differences in vibration level from measurement to measurement.
- Easy comparison - Simply upload a measurement file and get the damage index without further interaction.
- Can integrate with existing monitoring systems or operated using the well-known ARTeMIS Modal user interface.
The Statistical Subspace-based Damage Detection procedure consists of the following steps:
- Upload a set of measurement files acquired in a reference "undamaged" state of the structure.
- Estimate a Reference State Model as an average of the dynamic behavior of the uploaded measurement files.
- Test all individual measurement files of the reference state with the Reference State Model using Chi-Square testing. The outcome is a single Chi-Square value per measurement file. Use these values to establish an empirical Threshold for Chi-Square values being inside the undamaged Safe Zone.
- Upload measurement files of the potentially damaged structure and test against the Reference State Model using Chi-Square testing. If the estimated Chi-Square values exceed the threshold, it indicates a significant change of the dynamics of the structure being measured, and as such a potential damage.
In the case of the S101 bridge, a Reference State Model was constructed using the first 100 measurement files. These were acquired on the first day before the damaging process started. All 689 files were then uploaded one by one and tested against the Reference State Model.
Below, the results are presented in a bar diagram where all green bars represent measurements having Chi-Square values inside the threshold (Safe Zone) - the horizontal red line. The measurements used to establish the Reference State Model are highlighted with a gray background to the left of the diagram. When Chi-Square values exceed the threshold, the bars are colored red (Unsafe Zone). The start of the 11 progressive damage scenarios is also indicated with annotations in the top of the diagram.
As it appears from the diagram, the indicator reacts dramatically when the first damage is being introduced at the measurement (Session) indicated with the annotation A.
Analysis Session - External Storage
Having the results of all measurement records in a single project makes it much easier to present the historical development of the dynamic behavior of a structure being monitored. As the base for all SHM plugins in ARTeMIS Modal Pro, an Analysis History Task is introduced, see the above picture. The primary purpose of this task is to display results as a function of the Analysis Session.
Specifically for this case study, the Analysis History Task is used to present a Damage Indicator as a function of the 689 measurement records, each stored in an Analysis Session. Each Analysis Session is stored in a dedicated file with the extension *.amps. These files are located in an external storage specified by the user. It can be anywhere on the users network.
This case study presents an Operational Modal Analysis made with the Crystal Clear Stochastic Subspace Identification algorithm available in ARTeMIS Modal Pro. This algorithm is developed in cooperation with our strategic partner - the French Institute National de Recherche en Informatique et en Automatique (INRIA). This algorithm can be applied for both single and multiple setup measurements. In the present case study, the measurement campaign is divided into 28 test setups.
The Guadiana Bridge connecting Portugal and Spain
The International Guadiana Bridge is a concrete cable-stayed bridge, located in the southeast of Portugal, connecting Portugal and Spain over the Guadiana River. The bridge, designed by the Portuguese engineer Câncio Martins, was open to traffic in 1991 and was one of the first cable-stayed bridges with a moderate span constructed in Portugal.
The bridge is composed of a central span of 324 m, two lateral spans of 135 m and two transition spans of 36 m, resulting in a total length of 666m. The deck is a prestressed concrete box section, 18m wide and 2.5m high, with internal concrete bracings at 4.5m intervals. It is supported at the towers and suspended by stay-cables. These are arranged in a semi-fan, in a total of 32 pairs anchored at the top of each tower and at the deck at 1.8m and 9m intervals, respectively. The two A-shaped concrete towers, which provide vertical and lateral supports for the deck, are 100m high and are supported by pile groups, with 2.0m diameter piles, founded on schist rock.
 The International Guadiana Bridge.
 The towers suspended by stay-cables.
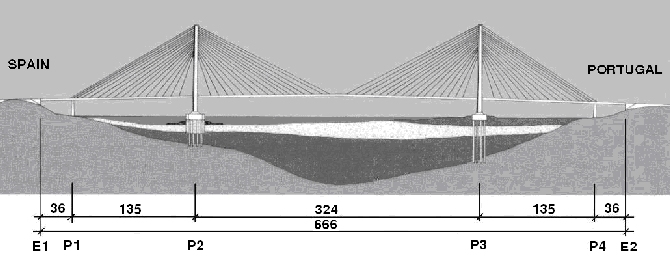 Side view of the bridge with distances in meters.
The Ambient Vibration Test
The measurements have been made by Professors Alvaro Cunha, Elsa Caetano and Filipe Magalhães, Faculdade de Engenharia da Universidade do Porto, Laboratory of Vibrations and Monitoring (http://paginas.fe.up.pt/vibest/), Porto, Portugal.
The considerable extension of the bridge makes the use of cables rather cumbersome and time consuming. Therefore, 4 triaxial 18-bit strong motion recorders were used in the present application. These devices are constituted by very sensitive internal force balance accelerometers (linear behaviour from DC to 100 Hz), 18 bit analog-to-digital converters (to guarantee high sensitivity), batteries that enable autonomy for one day of tests, memories materialized by removable Compact Flash cards that permit a fast download of the acquired data and external GPS sensors to ensure an accurate time, so that they can work independently and synchronously, avoiding the use of cables and minimizing the labour associated with the preparation of the dynamic test.
In the ambient vibration test of the International Guadiana Bridge, two recorders, permanently located at section 17 (see Figure 4) on both sides of the deck (locations 17U - upstream and 17D – downstream), served as references. The other two recorders scanned the bridge deck and towers in 28 consecutive test setups, measuring the acceleration along the 3 orthogonal directions in all the points represented in Figure 4. For each test setup, time series of 21 minutes (1260 seconds) were collected, corresponding to approximately 500 cycles of the longest vibration period of the structure. The sampling frequency was 100 Hz, value that is imposed by the filters of the acquisition equipment and that is much higher than necessary in the test of a cable-stayed bridge, where the most relevant natural frequencies are below 3 Hz.
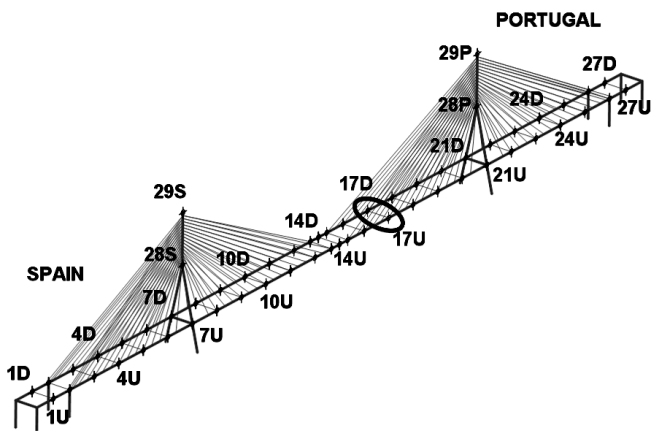 Measurement points (+) used in the ambient vibration test. The circled points are the reference locations.
Modal Analysis using the Crystal Clear SSI-UPC in ARTeMIS Modal Pro
After uploading the 28 test setups, the measurements were decimated to a new frequency range with a Nyquist frequency of 2.5 Hz. The Common SSI matrices were estimated using a Max. Dimension of 150 and the Stabilization Diagrams were estimated using Crystal Clear SSI estimator. Below, the Stabilization Diagram for test setup 9 is shown. It displays the Singular Values Decomposition (SVD) of the Spectral Densities of the measurements in the background. In front, the natural frequencies of stable modes of the 150 different state space models are presented in red.
Due to the extremely clear stabilization diagrams, the Automatic Mode Estimation feature was able to find 10 global modes.
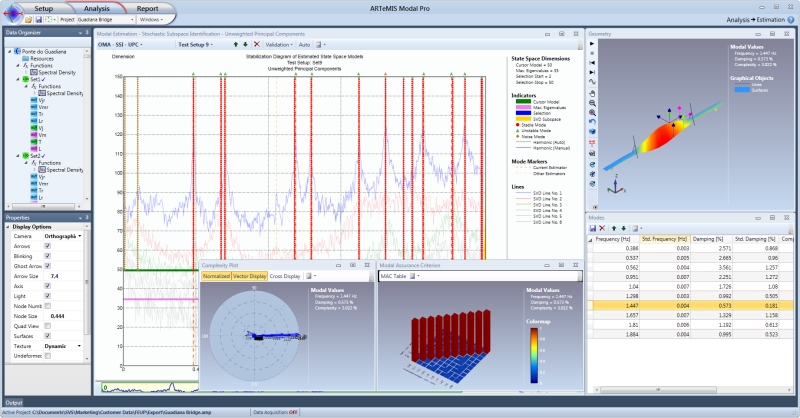 Stabilization Diagram of the Crystal Clear SSI-UPC algorithm for test setup 9. 10 global modes were estimated and can be seen in the Mode List in the lower right corner. The torsional mode at 1.447 Hz is presented in the Geometry Window and Complexity Plot. The Modal Assurance Criterion (MAC) of all the global modes is also shown.
Below, the mode shapes of all 10 global modes are presented. The second mode is a weakly excited transverse mode which is affected by measurement noise. The remaining nine modes are of good quality as seen below.
ARTeMIS software from SVS in the SOFIA project
SOFIA, the Stratospheric Observatory For Infrared Astronomy (SOFIA) is a flying infrared observatory. With this unique platform, scientists will be able to investigate for example the development of young stars and planetary systems or to examine the centre of our home galaxy, the Milky Way.
 The ARTeMIS software from Structural Vibration Solutions provides the best possibility to investigate structures like the SOFIA.
The major part of the infrared light of these celestial objects cannot penetrate the earth atmosphere due to the absorption of its water vapour. For this reason the German Aerospace Centre (DLR) and the National Aeronautics and Space Administration (NASA) started the SOFIA project for which a Boeing 747-SP was highly modified and equipped with a German telescope in the rear of the aircraft, weighing 17 tons and having a primary mirror diameter of 2.7 meter. In an altitude of about 13 kilometres the atmospheric influence on star observations is negligible, and hence observers will have an undisturbed view onto the infrared sky. SOFIA will presumably start with scientific observations in late 2009, which is the International Year of Astronomy.
The German contribution to the project is the development, construction and testing of the telescope which is the heart of the observatory. At the intended aircraft altitude of SOFIA, the telescope will be placed in a highly unprofitable environment for precise observations. For example the aero acoustic loads on the telescope due to the open cavity of a size of about 3 x 3 metres as well as the vibrations of the aircraft itself will stimulate vibrations of the whole structure. In order to guarantee that the required pointing stability is met by the observatory, these effects have to be known and controlled well. Hence engineers from the German SOFIA Institute (DSI) at the Universitaet Stuttgart , which operates the SOFIA telescope on behalf of DLR need to derive the exact dynamical parameters of the telescope.
The ARTeMIS software from Structural Vibration Solutions A/S provides the best possibility to investigate structures like the SOFIA telescope under its realistic operation conditions. For that ARTeMIS does not depend on the use of well defined, artificial signals for the stimulation, but takes advantage of those provided by the actual disruptions like the wind loads and aircraft vibration itself. With that approach the DSI engineers can determine the stimulated telescope vibrations that occur during real observing conditions and investigate for example their dependence from the cavity temperature which is about minus 40 degrees Celsius.
|