Do you need to do modal analysis without controlling the input?
You might wonder what Operational Modal Analysis, OMA, is and how it differs from the traditional Experimental Modal Analysis (EMA) that has been around for the past few decades. Operational Modal Analysis is also called output-only modal analysis, ambient response analysis, ambient modal analysis, in-operation modal analysis, and natural input modal analysis. No matter the name, the idea is the same: Conduct a modal analysis without knowing and/or controlling the input excitation. This modal technology is capable of estimating the same modal parameters as the traditional known techniques. The modal parameters are the mode shape, the natural frequency and the damping ratio. Some thinks that Operational Modal Analysis just is another name for Operating Deflection Shapes, ODS. This is not the case. Operational Modal Analysis separates noise and inputs from the outputs and returns the unbiased modal information only.
There are a number of benefits in using the Operational Modal Analysis compared to the more traditional techniques:
- Input Multiple Output Modal Technology.
The Operational Modal Analysis are Multiple Input Multiple Output, MIMO, techniques. This means that the techniques are capable of estimating closely space modes and even repeated modes with a high degree of accuracy. Traditional modal anlysis techniques are typically Single Input Multiple Output, SIMO, or Multiple Input Single Output, MISO, or in rare cases even Single Input Single Output, SISO. Such testing procedures will not be able to find repeated poles due to the lack of mode separation.
- Easier Laboratory Modal Testing.
There is no need for vibration shaker or impact hammer anymore. If you are in your lab doing modal testing in a test rig on some structural component, just do some random tapping on the structure while you are measuring the vibration response in multiple locations. The tapping must be random in time but also spatially. The excitation produced in this way will be a good approximation of a multivariate white noise stochastic process.
- Winning Technology in In-situ Modal Testing.
The Operational Modal Analysis are Multiple Input Multiple Output, MIMO, techniques. This means that the techniques are capable of estimating closely space modes and even repeated modes with a high degree of accuracy. Traditional modal anlysis techniques are typically Single Input Multiple Output, SIMO, or Multiple Input Single Output, MISO, or in rare cases even Single Input Single Output, SISO. Such testing procedures will not be able to find repeated poles due to the lack of mode separation.
- Modal Analysis in the Presence of Harmonic Excitation.
The presence of rotating components "harmonics" in the data has for years been a nightmare to deal with. In many applications where rotating machinery is present in the structure being tested, it has been necessary to switch of the operation of the rotaing machinery while doing the modal analysis, or it has been necessary to rely on the use of Operating Deflection Shapes (ODS) analysis. However, ARTeMIS Modal is born with the ability to handle "harmonics" from rotating components, such as motors, pumps, propellers, wind turbines and generators.
Please have a look at the Technical Review for a technical introduction OMA and its similarities and differences to EMA.
ARTeMIS Modal - Cutting edge Operational Modal Analysis software since 1999
ARTeMIS Modal is a powerful and versatile tool for Operational Modal Analysis. Its ability to produce validated modal parameter estimates, based on parallel analysis of up to eight different analysis techniques, makes it the natural choice in mission critical applications.
From the patented Enhanced Frequency Domain Decomposition (EFDD) techniques to the unique Crystal Clear Stochastic Subspace Identification (SSI) techniques, ARTeMIS Modal enable engineers to obtain validated estimates the mode shapes, natural frequencies and damping ratios, directly from the raw measured time series data of structures under natural conditions.
The software is designed for the vast number of cases where it is preferred not to control or measure the loading.The software is used by engineers all over the world for modal analysis of all kinds of structures:
- Operating machinery or other mechanical structures with or without rotating components.
- Large civil engineering structures like bridges, dams and buildings subjected to ambient loads.
- Structures with rotating components such as wind turbines, stream turbines, engines and gas compressors.
- Maritime structures like ships and offshore structures.
- Automotive, trucks, trains and vehicles and sub parts systems.
- Aerospace structures such as launch vehicles and aircrafts.
- The software is an open, and user friendly platform for modal testing, modal analysis and modal problem solving. If you can measure the vibrations, ARTeMIS Modal can give you the modes in terms of mode shape, natural frequency and damping ratio.
Available Operational Modal Analysis Estimators - Time Domain
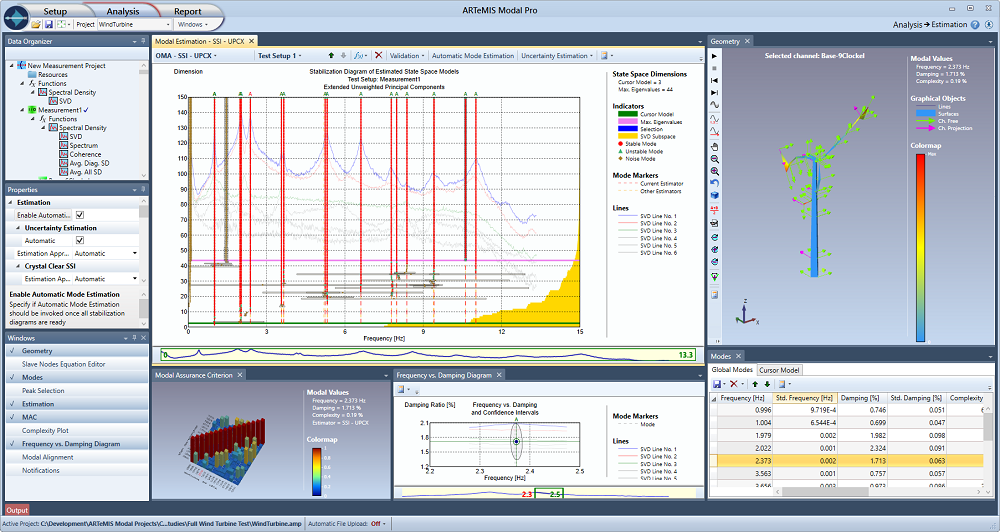
ARTeMIS Modal Pro includes up to five time domain modal analysis techniques. They are all of the data driven Stochastic Subspace Identification (SSI) type and all implementing the powerful Crystal Clear SSI feature. This feature result in extremely clear stabilization diagrams with un-seen accuracy of the physical parameters and nearly no noise modes. The techniques available are:
- Extended Unweighted Principal Component - SSI-UPCX.
- Unweighted Principal Component - SSI-UPC.
- Principal Component - SSI-PC.
- Canonical Variate Analysis - SSI-CVA.
- Unweighted Principal Component Merged Test Setups - SSI-UPC-Merged.
These techniques estimate the modal parameters directly from the raw measured time series. The SSI techniques incorporate effective ways of dealing with noise. As a result, the modal parameter estimations are the most accurate commercially available today. The SSI techniques can work with closely space and repeated modes with light or heavy damping. Since they are working in time domain there are no leakage bias or lack of frequency resolution, see below. As a result, the modal parameter estimates are asymptotically unbiased. Further, as the SSI techniques are low model order estimators, the statistical errors of the modal parameter estimates are extremely small.
Features
- Modal parameter estimation based on estimation of state space models in time domain.
- State space model estimation can be done on even large channel counts through the use of Projection Channels.
- Projection Channels can be found manually, semi-automatic or fully automatic.
- Very fast estimation of even hundreds of models of increasing dimension.
- Very limited user interaction required. Can be fully automated. By default, the techniques always start with an fully automatic estimation of the global modes.
- Unbiased modal parameter estimation using standard least-squares or the Crystal Clear SSI® solver.
- Estimation of uncertainties of extracted modal parameters (SSI-UPCX).
- Handles single or multiple Test Setups.
- Modal parameters can be extracted in the presence of deterministic (harmonic) signals from e.g. rotating machinery.
- Extraction of global mode estimates can be made manually or automatic.
- Estimated state space models can be validated against data in frequency domain. Both spectral response and prediction errors can be validated.
- Estimated state space models as well as the entire stabilization diagram can be exported in ASCII file format for use outside ARTeMIS Modal.
- All SSI methods are available in the ARTeMIS Modal Pro version.
Benefits
- Unbiased estimation – No systematic estimation errors. No leakage – The SSI techniques work in time domain and are data-driven methods. Since the model estimation is not relying on any Fourier transformations to frequency domain no leakage is introduced. Leakage is always introduced when applying the Fourier transformation and assuming periodicity. Leakage always results in an unpredictable overestimation of the damping. No problems with deterministic signals (harmonics) – Since the modal parameters are extracted directly by fitting parameters to the raw measured time histories, the presence of deterministic signals, such as harmonics introduced by rotating machinery, does not create problems. Harmonics are just estimated as very lightly damped modes. This is in contrast to frequency domain methods relying on the estimation of half power spectral densities that all assume that the excitation is broad-banded (white noise). Using these methods in presence of deterministic signals introduce bias in the modal parameter estimation.
- Less random errors. Low-order model estimator - SSI algorithms are born linear least-squares fitting techniques fitting state space systems with correct noise modeling. This leads to the use of much smaller model orders than other commercially available high order model estimators. These estimators are often used to approximate a non-linear least squares problem with a linear least-squares fitting problem. This is an often seen approximation when fitting e.g. polynomial matrix fractions. In order for this approximation to work, a high-order polynomial order is needed. Since this leads to the use of many parameters compared to a low-order technique, the uncertainties of the high-order parameter estimates becomes larger. More parameters are fitted with the same amount of data available, meaning less independent information per estimated parameter. All modal parameters are fitted in one operation. All parameters fitted are taking advantage of the noise cancellation techniques of the orthogonal projection of SSI. Other commercially available methods often fit the poles (frequency and damping) first, and then use the noisy spectral data and the estimated poles to fit the mode shapes resulting in poor mode shape estimates.
- Automatic Mode Estimation. All SSI techniques includes automatic mode estimation that searches the stable modes in the SSI Stabilization Diagram. All stable modes of all estimated models of all test setups are included in the search, and the result is modal estimates of natural frequencies, damping ratios and modes shapes of high accuracy. The estimates are presented in terms of both mean values and standard deviations. Even in the case of closely spaced or repeated modes and multiple test setups, the automatic mode estimation for SSI works.
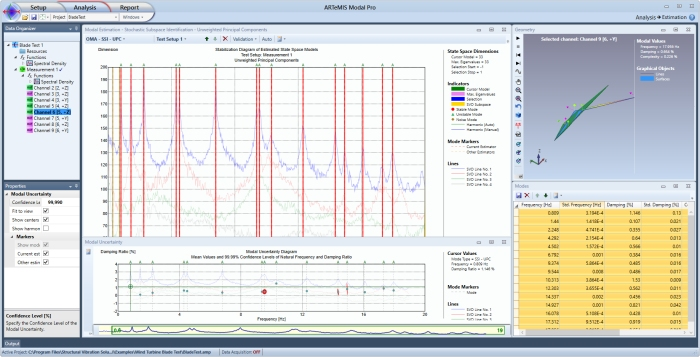
- Estimation of Modal Uncertainties. Modal estimation methods that make use of Stabilization Diagrams only present, in general, the estimated mean values of the modal parameters. Typically, Stabilization Diagrams show the mean values of the natural frequencies of the estimated modes with respect to selected model dimensions. In a diagram like this, the search for stable modes is made on the basis of the mean values. Even if the stabilization is clear, it is still difficult to assess the level of confidence that can be associated with each of the presented modes. In the SSI-UPCX technique it is possible to visualize the uncertainty of the individual estimates in terms of confidence bounds around the mean values. These uncertainties are taken into account when estimating the global modes in SSI-UPCX.
Application of Operational Modal Analysis
There are many applications where Operational Modal Analysis is the natural choice of technology for supplying structural information. Below a few examples are listed. For more examples please visit the case studies page.
Back in the 1980's civil engineers were among the first to adapt Operational Modal Analysis (OMA) for testing of large structures. The size of the civil engineering structures and the fact that ambient excitation typically is uncontrollable pushed the development of OMA techniques heavily in this area. Today OMA is a wide spread technology used in many engineering field but testing of civil engineering structures is still the most popular OMA application. Back in 1999, ARTeMIS software was originally developed as a spin-off of research made Aalborg University, Department of Civil Engineering, and even the ARTeMIS name refer to its civil engineering roots as it is the abbreviation of Ambient Response Testing and Modal Identification Software.
Below a list of typical civil engineering applications are presented.
Bridges
Bridges have been in focus for decades due to the slender structure that makes them dynamical sensitive. The most famous example of a bridge disaster caused by dynamic effects is probably the Tacoma Narrows Bridge disaster. In case a bridge collapses, it has enormous impacts both economically and for the society. Large bridges are therefore typically tested in the commissioning state for design verification and perhaps flutter analysis. A typical example is the ambient test of the Vasco da Gama Bridge in Portugal that is shown in the below picture.
The test of the Infante D. Henrique Bridge and the Guadiana Bridge are other examples from the Laboratory of Vibrations and Monitoring at University of Porto.
Smaller bridges like highway crossings have also been the subject for many years. Here the major concern typically is deterioration over time due to environmental effects. Combine this with the vast number of highway bridges typically present in a country is one of the reasons why this type of applications also attrack a lot of focus. Several research projects has concerned structural health monitoring of this type of structures. One of the recent projects are the IRIS project concerning the Austrian S101 highway bridge.
High Rise Buildings
High rise buildings are other types of dynamic sensitive structures, and specially in earthquake active regions, it is important to know the fundamental modes of these structures. Below a typical example is shown. This is the Heritage Court Tower located in Vancouver, British Columbia, Canada.
One of the challenges of analyzing building are the typical use of architectual symmetry. This causes closely spaced modes, i.e. modes have different mode shapes but natural frequencies of more or less same values. This is also the case in the above example, but by using the Stochastic Subspace Identification techniques of ARTeMIS Modal Pro it is possible to extract all the excited modes even in this case.
There are several reasons why ARTeMIS software for Operational Modal Analysis (OMA) is a popular tool in wind turbine applications.
Design Verification and Optimization
First of all, there is a growing need to know the dynamic behavior of wind turbines under the right operational conditions when the true environmetal forces are acting on the structure. This need is caused by the rapid development in the dimensions of the turbines. The larger the dimensions get the lower the dynamic behavior in frequency gets. This put the numerical models under pressure and there natural becomes a need for experimental verification of these. In some cases it is even required to follow an experimental study with an updating of the numerical models.
Secondly, sub-parts such as blades and tower are typically having well documented dynamic characteristics that are provided independently of each other. However, problems arises when these subparts are integrated with e.g. the nacelle and the foundation. The integration of course has a serious impact of the dynamic behaviour of the subparts. In order to study this impact OMA is the natural tool to make use of. See e.g. the case study of the FE model updating of the Fuhrländer AG 2.5 MW wind turbine. OMA will return results for the complete turbine behavior under the right environmental conditions. This makes it possible to update numerical models of the complete turbine to behave correctly under the operational conditions of the test.
A typical example of a full-scale test is shown in the below pictures and documented in the paper Artificial and Natural Excitation Testing of SWiFT Vestas V27 Wind Turbines.

 Frequency Domain Decomposition analysis. Frequency Domain Decomposition analysis.
 Crystal Clear Stochastic Subspace Identification analysis. Crystal Clear Stochastic Subspace Identification analysis.
Easier Documentation of Sub Parts Dynamic Behaviour
Dynamic characterization has been applied in sub part testing in case of e.g. blades. A popular approach has been a free response testing scheme where each mode of the blade is determined in a single test by applying excitation in carefully selected locations of the blade. This is a very costly way of testing as it is time consuming, and there is a potential risk that multiple modes are excited at the same time which consequently will polute the results. In this case, OMA has made life easier for several test institutions. The reason is that all modes now accurately can be determined from a single test.
 Crystal Clear Stochastic Subspace Identification modal analysis of a wind turbine blade. Crystal Clear Stochastic Subspace Identification modal analysis of a wind turbine blade.
There are different ways to handle the problems arising from the harmonic components in the vibration measurements. These can be divided as follows:
- Use harmonic detection to locate the harmonic peaks and then use this knowledge when estimating modes.
- Use a harmonic reduction approach to remove the harmonic peaks before a modal estimation.
- Use modal estimation techniques robust to the presence of harmonic componets in the measurements.
The optimal approach is to use a combination of the above tools. Below an real life example shows how the tools can be combined.
Operational Modal Analysis of a Ship in the Presence of Harmonic Excitation
This case study demonstrates how the use of Harmonic Detection and Peak Reduction makes it easy to estimate modes from of a ship, even in the presence of significant harmonic excitation. The measurements and analysis presented here have been performed by University of Rostock, Faculty of Mechanical engineering. Chair of Technical Mechanics.
The measurements have been made under fully operational conditions; the responses are recorded using a 16 channel acquisition system and sampled with 128 Hz. Here the data has been analyzed up to 12.8 Hz as there are no modes of interest above this frequency.
One of the major challenges has been a severe harmonic peak very close to the resonance of one of the fundamental modes of the structure. Additional orders of this harmonic frequency are also very significant in energy. A higher order mode at 8.2 Hz is masked by the harmonics of the same frequency. The aim of this analysis is to remove the harmonic peaks that render the operational modal analysis of this data less effective, and to estimate the global modes of the ship.
Technical Specifications of the Ship
The ship tested has the following technical specifications:
- Build at Flensburger Schiffbau Gesellschaft.
- Dimensions: length over all: 199.8 m
- Speed: 22.5 kn
- Main engine: 9L 60 MC-C (MAN B&W, 9 cylinder)
- Power: 20.070 kW
- Speed: 123 rpm
- Working process: two-stroke
- 4-bladed propeller with controllable pitch
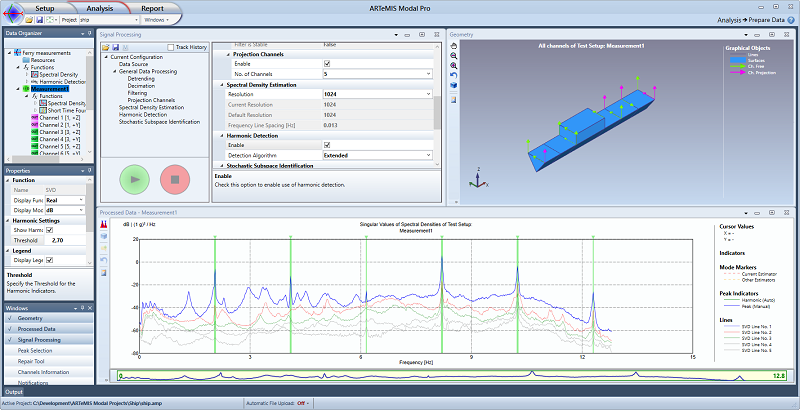
Step 1 - Detection of Harmonic Excitation Peaks
The first step is to use the harmonic detection available in ARTeMIS Modal. This detection loops through the measurement channels applying a sliding bandpass filter to determine the level of Kurtosis at different frequencies. In the Fast Detection approach only a few potential frequencies are evaluated, whereas in the Extended Detection approach all frequencies, available in the corresponding spectral density spectra, are evaluated.
If the Kurtosis at a frequency drops much below 3, then it is a sign that the data at this particular frequency isn't normally distributed, which is the usual case of modal response from several independent input sources. In this case a green indicator is shown to signal that the data at this particular frequency might be from some rotating component rather than from a mode.
Below the Extended Detection has been applied. The green indicators are clearly showing at what frequencies the harmonic peaks are located.
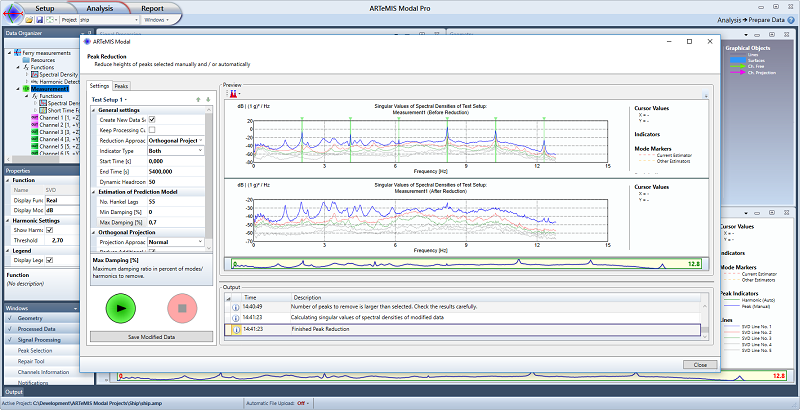
Step 2 - Reduction of Harmonic Excitation Peaks
Once the most significant harmonic peaks have been identified, the second step is to perform a reduction of these peaks as well as other very lightly damped modes (<0.7%). The results of the harmonic peak reduction are illustrated on the figure below. The top diagram presents the Singular Values of the spectral densities of the original measurements as well as the six harmonic peaks to reduce. The bottom diagram shows the modified data after reduction.
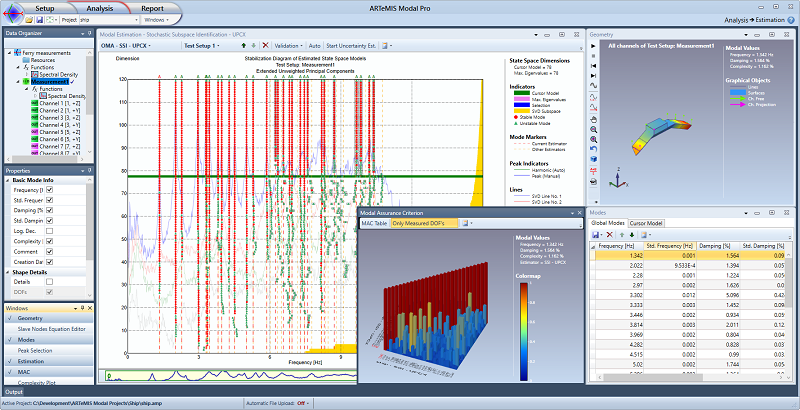
Estimation of Modes
Estimation of the modes of the ship has been performed using the UPCX Crystal Clear SSI method with built-in uncertainty estimation of the modes. In this case state space models with dimension from 1 to 120 has been estimated and a stabilization diagram constructed as seen in the figure below. The global modes have then been automatically extracted from the diagram taking the estimated uncertainties into account. This allow a very accurate extraction of more than 25 modes in the selected frequency band.
Related Information
Technical Specifications for ARTeMIS Modal
M. Döhler, P. Andersen, L. Mevel: Variance Computation of Modal Parameter Estimates from UPC Subspace Estimation
Proceedings of the 7th International Operational Modal Analysis Conference (IOMAC), Ingolstadt, Germany, 2017.
M. Döhler, P. Andersen, L. Mevel: Operational Modal Analysis using a Fast Stochastic Subspace Identification Method
Proceedings of the 30th International Modal Analysis Conference (IMAC) Jacksonville, Florida USA, 2012.
S. Gres, P. Andersen, C. Hoen, L. Damkilde: Orthogonal projection-based harmonic signal removal for operational modal analysis
Proceedings of the 36th International Modal Analysis Conference (IMAC), Orlando, Florida, 2018.
S. Gres, P. Andersen, L. Damkilde: Operational Modal Analysis of Rotating Machinery
Proceedings of the 36th International Modal Analysis Conference (IMAC), Orlando, Florida, 2018.
Subscribe to ARTeMIS Newsletter
|
|